
Use Case Guides
Debugging Production Issues
Debugging Production Issues
Production database issues are stressful and urgent. When users report problems, data looks corrupt, or queries are slow, you need to diagnose the root cause quickly. WhoDB provides a safe way to inspect production databases when used with read-only database credentials, without risking data integrity or performance.
Tip
This guide covers safe debugging techniques, SQL patterns for investigation, and systematic approaches to finding and understanding production issues.
The Challenge of Production Debugging
Production databases contain real, critical data. This reality shapes how you investigate issues:
Constraints:
- Read-only access only (you shouldn't modify production data)
- Performance matters (heavy queries affect users)
- Interruptions cost money (downtime is unacceptable)
- High stakes (wrong diagnosis leads to wrong solutions)
Objectives:
- Understand the root cause quickly
- Minimize impact on production traffic
- Provide evidence-based diagnosis
- Enable targeted fixes
WhoDB — connected with read-only database credentials — plus its efficient querying and data visualization make it well suited for this challenging task.
Before You Start: Connection Setup
Use a Read-Only Connection
Never debug production with write access. Set up a read-only database user:
sql
-- PostgreSQL: Create read-only role
CREATE ROLE readonly_debugger WITH LOGIN PASSWORD 'secure_password';
GRANT CONNECT ON DATABASE production TO readonly_debugger;
GRANT USAGE ON SCHEMA public TO readonly_debugger;
GRANT SELECT ON ALL TABLES IN SCHEMA public TO readonly_debugger;
ALTER DEFAULT PRIVILEGES IN SCHEMA public GRANT SELECT ON TABLES TO readonly_debugger;

-- MySQL: Create read-only user
CREATE USER 'readonly_debugger'@'%' IDENTIFIED BY 'secure_password';
GRANT SELECT ON production.* TO 'readonly_debugger'@'%';
FLUSH PRIVILEGES;
Connect to production in WhoDB using this read-only account:
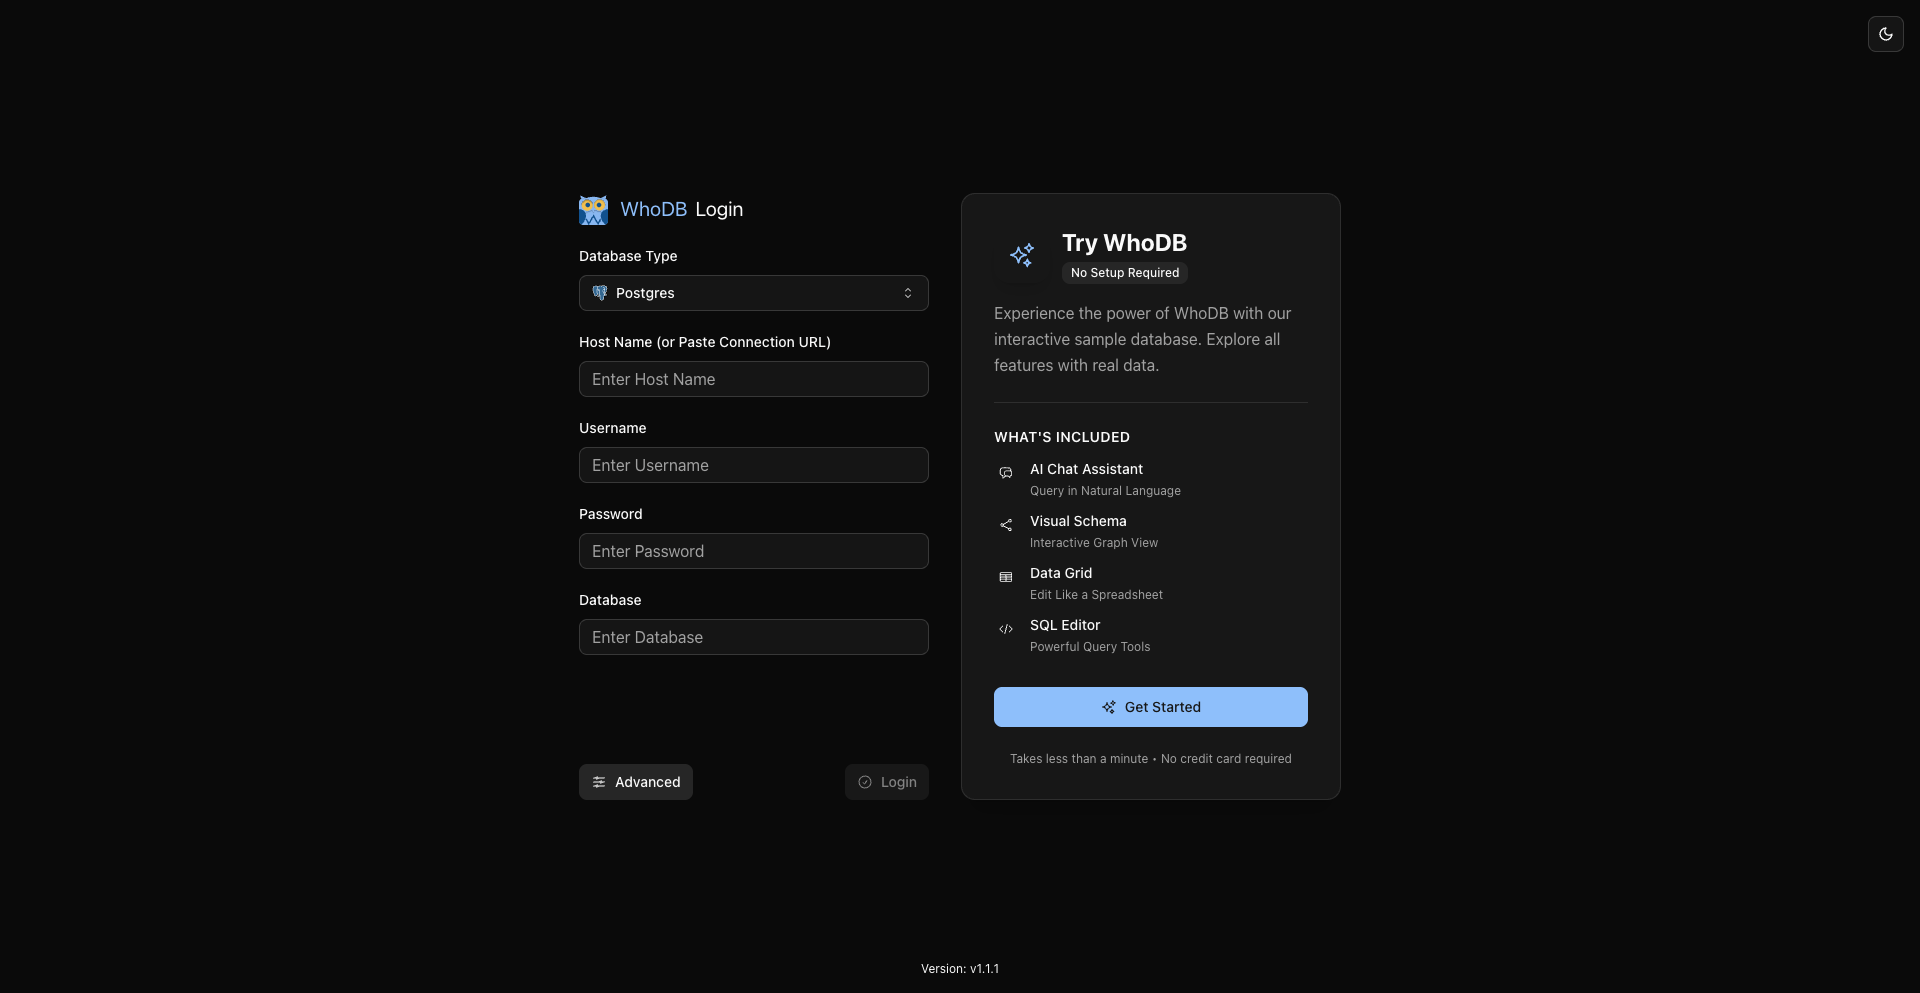
This prevents accidental modifications while you're investigating.
Understand Performance Impact
Even SELECT queries impact production if they're heavy. Follow these guidelines:
- Add LIMIT: Always limit result sets (LIMIT 1000 not LIMIT 1000000)
- Use WHERE clauses: Filter aggressively to reduce rows scanned
- Check indexes: Use indexed columns in WHERE conditions
- Test first: Run queries in non-peak hours when possible
- Monitor queries: Watch for slow-running investigations
sql
-- GOOD: Targets specific data with LIMIT
SELECT * FROM user_events
WHERE user_id = 12345
AND created_at > NOW() - INTERVAL '1 hour'
LIMIT 1000;

-- BAD: Could scan entire table and return millions
SELECT * FROM user_events;
Common Debugging Approaches
Missing or Corrupt Data
When users report data problems, first establish the scope, then look for a pattern.
sql
-- How widespread is it, and when did it start?
SELECT
  DATE_TRUNC('hour', created_at) as hour,
  COUNT(*) as record_count,
  COUNT(CASE WHEN status = 'lost' THEN 1 END) as affected_count
FROM user_events
WHERE created_at > NOW() - INTERVAL '72 hours'
GROUP BY DATE_TRUNC('hour', created_at)
ORDER BY hour DESC;
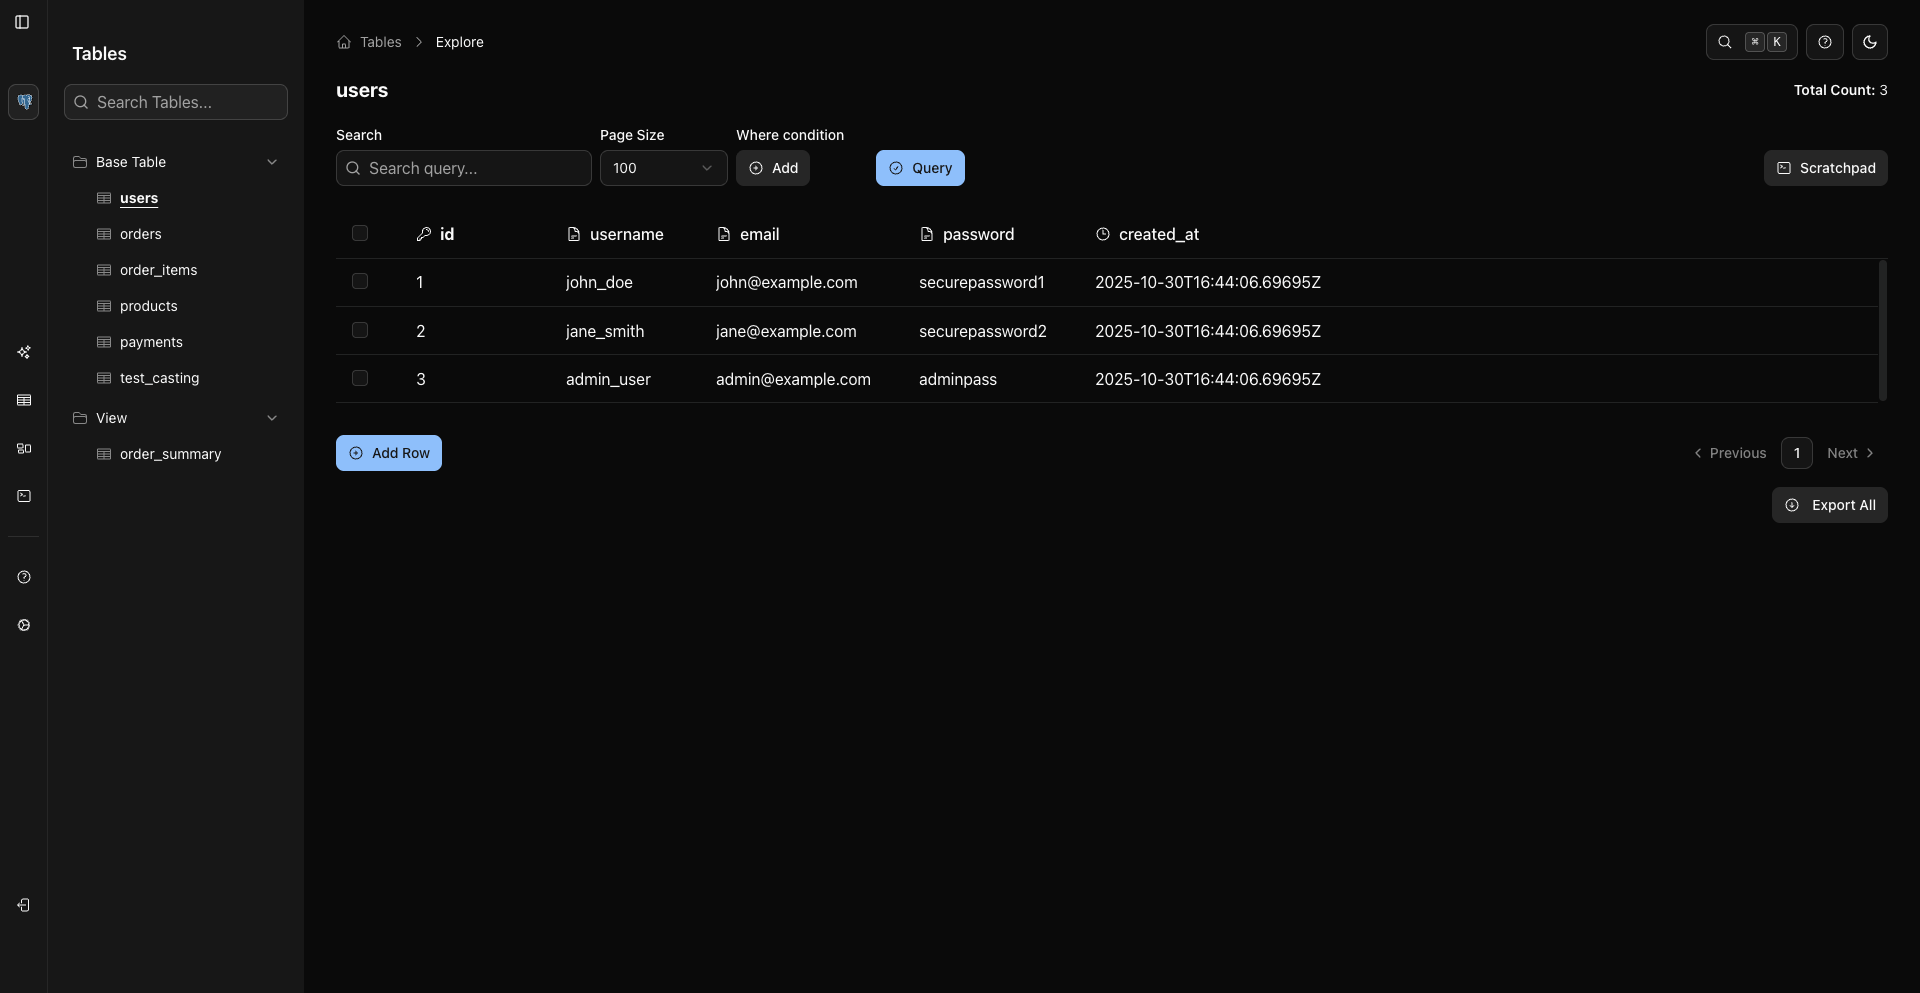
A sharp change in the affected percentage marks when the problem started — correlate that hour with deployments, imports, or configuration changes. Then sample affected records (WHERE status = 'lost' LIMIT 10) next to normal ones and use WhoDB's data view to spot the differences: missing fields, wrong values, encoding issues, truncated text.
Slow Queries or Performance Degradation
Use the Scratchpad to time a known query and compare it with its usual performance:
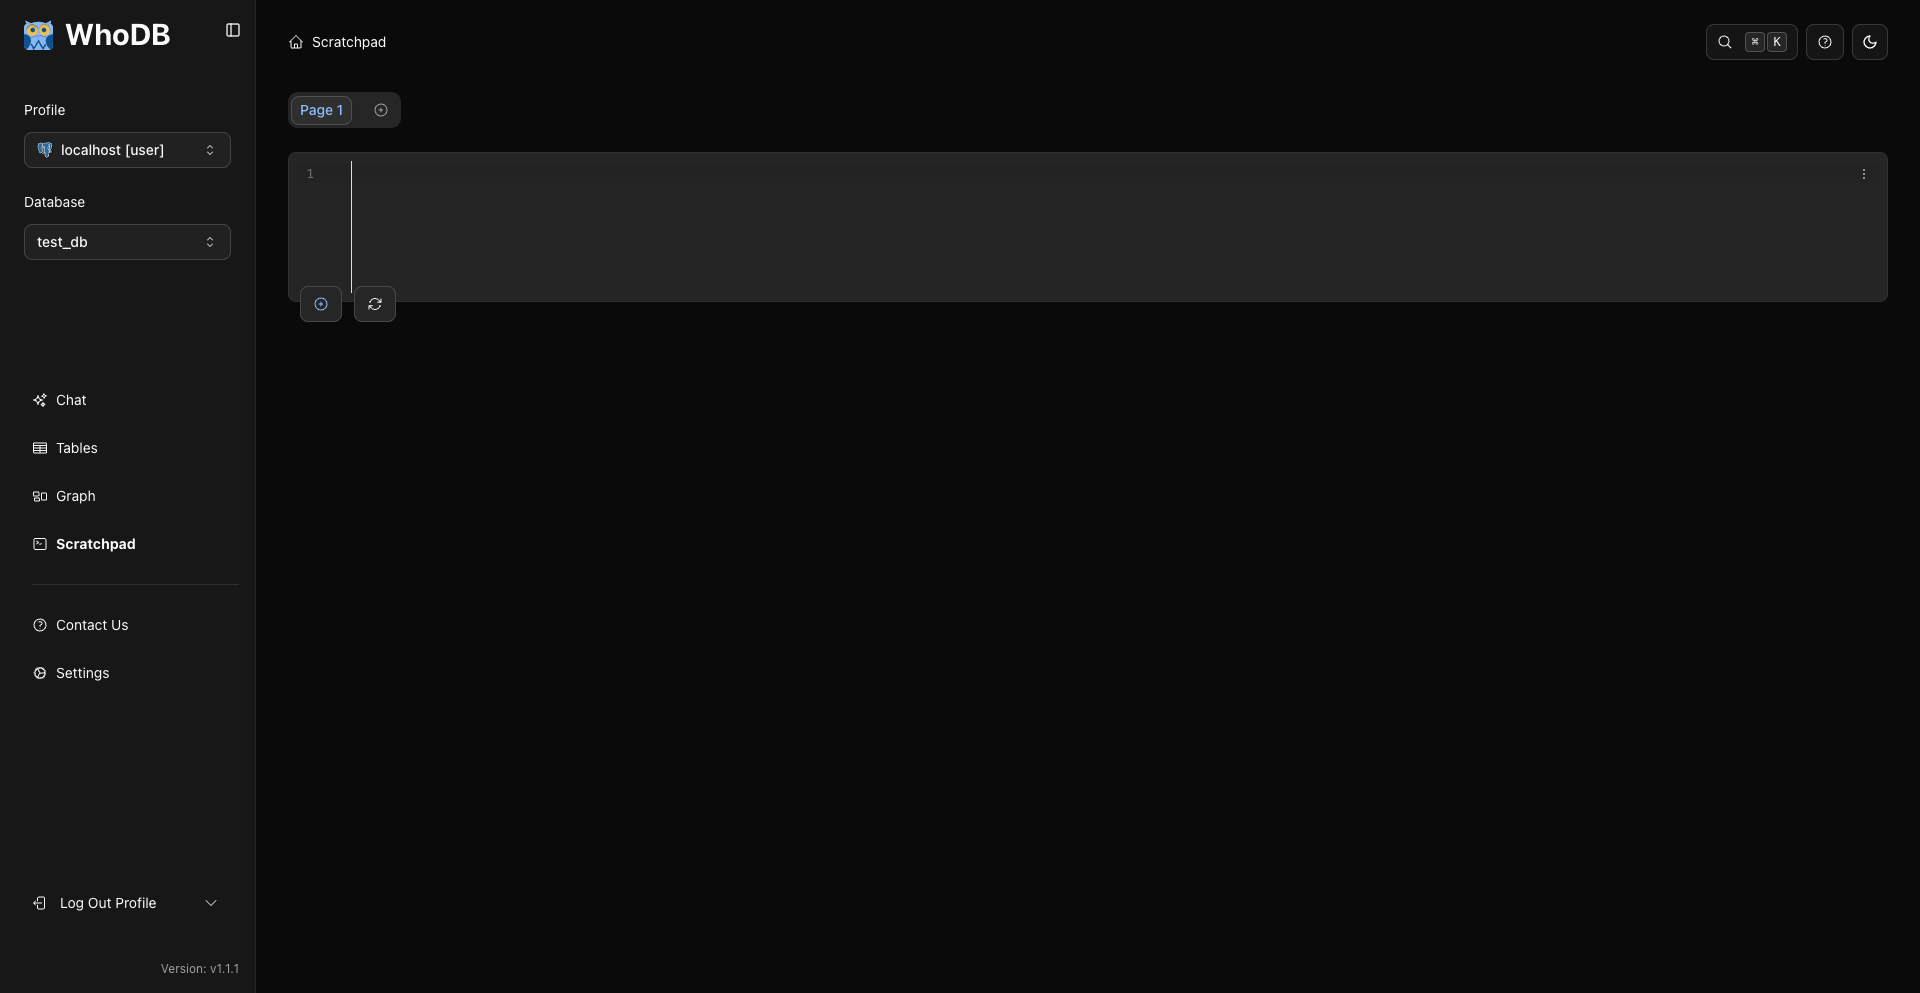
If it's slower than expected, check the execution plan and index usage:
sql
-- PostgreSQL: See how the query executes
EXPLAIN ANALYZE
SELECT * FROM orders WHERE customer_id = 123;

-- PostgreSQL: Are indexes being used?
SELECT schemaname, tablename, indexname, idx_scan
FROM pg_stat_user_indexes
ORDER BY idx_scan DESC
LIMIT 20;

-- MySQL equivalents
EXPLAIN SELECT * FROM orders WHERE customer_id = 123;
SHOW INDEX FROM orders;
Look for sequential scans on large tables that should use indexes, and indexes with near-zero idx_scan counts (possibly dropped or unused). Also check for lock contention and long-running transactions:
sql
-- PostgreSQL: Long-running queries
SELECT pid, now() - query_start AS duration, state, query
FROM pg_stat_activity
WHERE state != 'idle'
AND (now() - query_start) > interval '5 minutes';

-- MySQL
SHOW PROCESSLIST;
Data Inconsistency and Referential Integrity
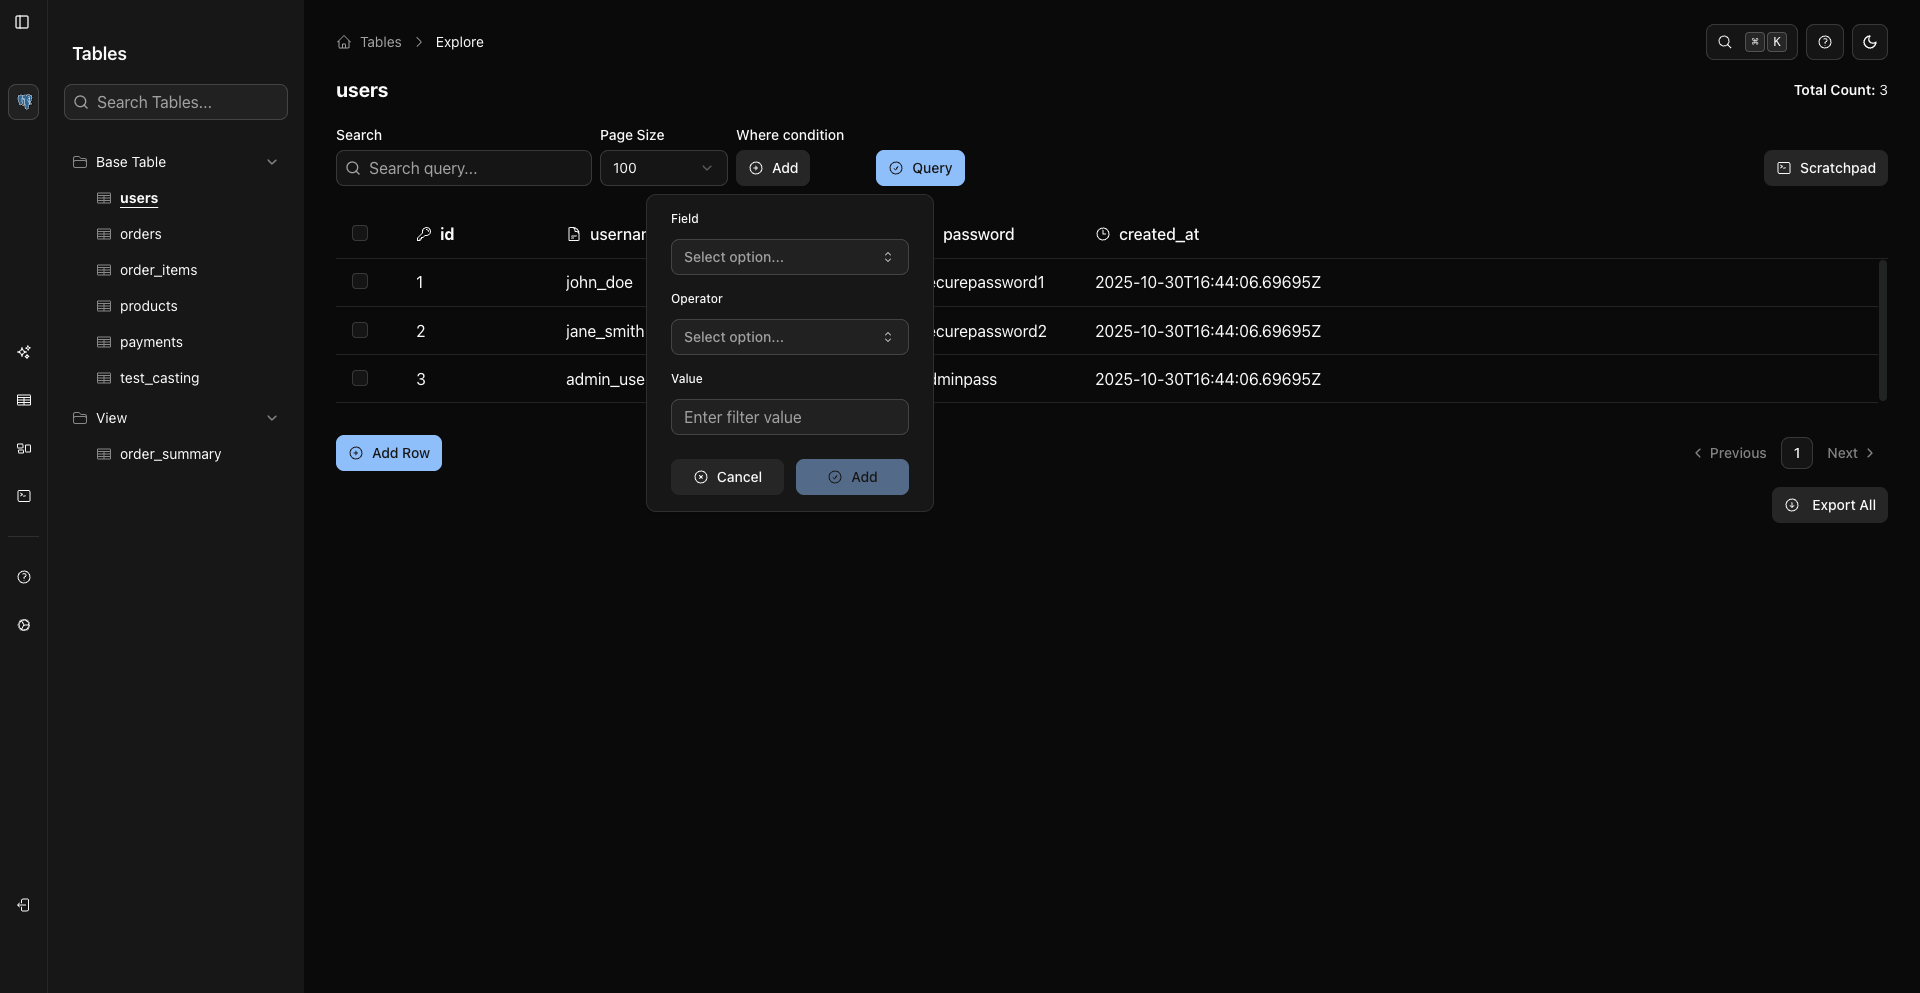
Broken relationships between tables cause failing queries or wrong results.
sql
-- Orphaned records: children with no matching parent
SELECT o.id, o.customer_id, o.created_at
FROM orders o
LEFT JOIN customers c ON o.customer_id = c.id
WHERE c.id IS NULL
LIMIT 100;

-- Duplicates that should be unique
SELECT email, COUNT(*) as cnt
FROM customers
GROUP BY email
HAVING COUNT(*) > 1
ORDER BY cnt DESC;

-- Values that violate expectations
SELECT * FROM orders WHERE total_amount < 0 LIMIT 10;
SELECT * FROM orders WHERE created_at > NOW() LIMIT 10;
Orphans and duplicates usually point to failed constraint enforcement, race conditions, or import errors. Group the problem records by creation date to find when the issue began, then correlate with deployments and data changes.
Recently Changed Data
When something "just broke", recent modifications are the first suspects:
sql
-- Records modified today
SELECT * FROM orders
WHERE DATE(updated_at) = CURRENT_DATE
ORDER BY updated_at DESC
LIMIT 100;

-- Bulk operations (many updates at the same instant)
SELECT updated_at, COUNT(*) as update_count
FROM orders
WHERE updated_at > NOW() - INTERVAL '24 hours'
GROUP BY updated_at
ORDER BY update_count DESC
LIMIT 20;
Safe Query Patterns for Production Debugging
Always use these patterns when debugging production:
Debugging Workflow Checklist
Use this systematic approach when debugging production:
Monitoring After a Fix
After the issue is fixed, re-run your investigation queries to verify:
sql
-- The affected count should be zero or much lower
SELECT
  DATE_TRUNC('hour', created_at) as hour,
  COUNT(*) as record_count,
  COUNT(CASE WHEN status = 'lost' THEN 1 END) as affected_count
FROM user_events
WHERE created_at > NOW() - INTERVAL '24 hours'
GROUP BY DATE_TRUNC('hour', created_at)
ORDER BY hour DESC;
Save these queries for future reference. When similar issues occur, you can quickly run the same diagnostics.
Next Steps
Master debugging with these related guides:
Check
Systematic, evidence-based debugging transforms you from guessing to knowing. With read-only credentials, efficient queries, and WhoDB's data visualization, you can safely investigate production issues without risking your data. By following these patterns and maintaining a library of debugging queries, you'll become the person who solves production problems with confidence, armed with data and clear analysis.
Previous
Next