
Visualization
Schema Topology
Schema Topology
Schema topology refers to the overall structure and organization of tables and relationships within your database. WhoDB visualizes this topology using an interactive graph that automatically arranges tables to show their connections and dependencies.
Info
Understanding your schema topology is crucial for making informed database design decisions and optimizing queries
What is Schema Topology?
Schema topology is the complete picture of:
- Tables: All database objects (tables, views, materialized views)
- Relationships: Connections between tables via foreign keys
- Cardinality: The nature of relationships (one-to-one, one-to-many, many-to-many)
- Organization: How tables are logically grouped and dependent on each other
The Graph Visualization
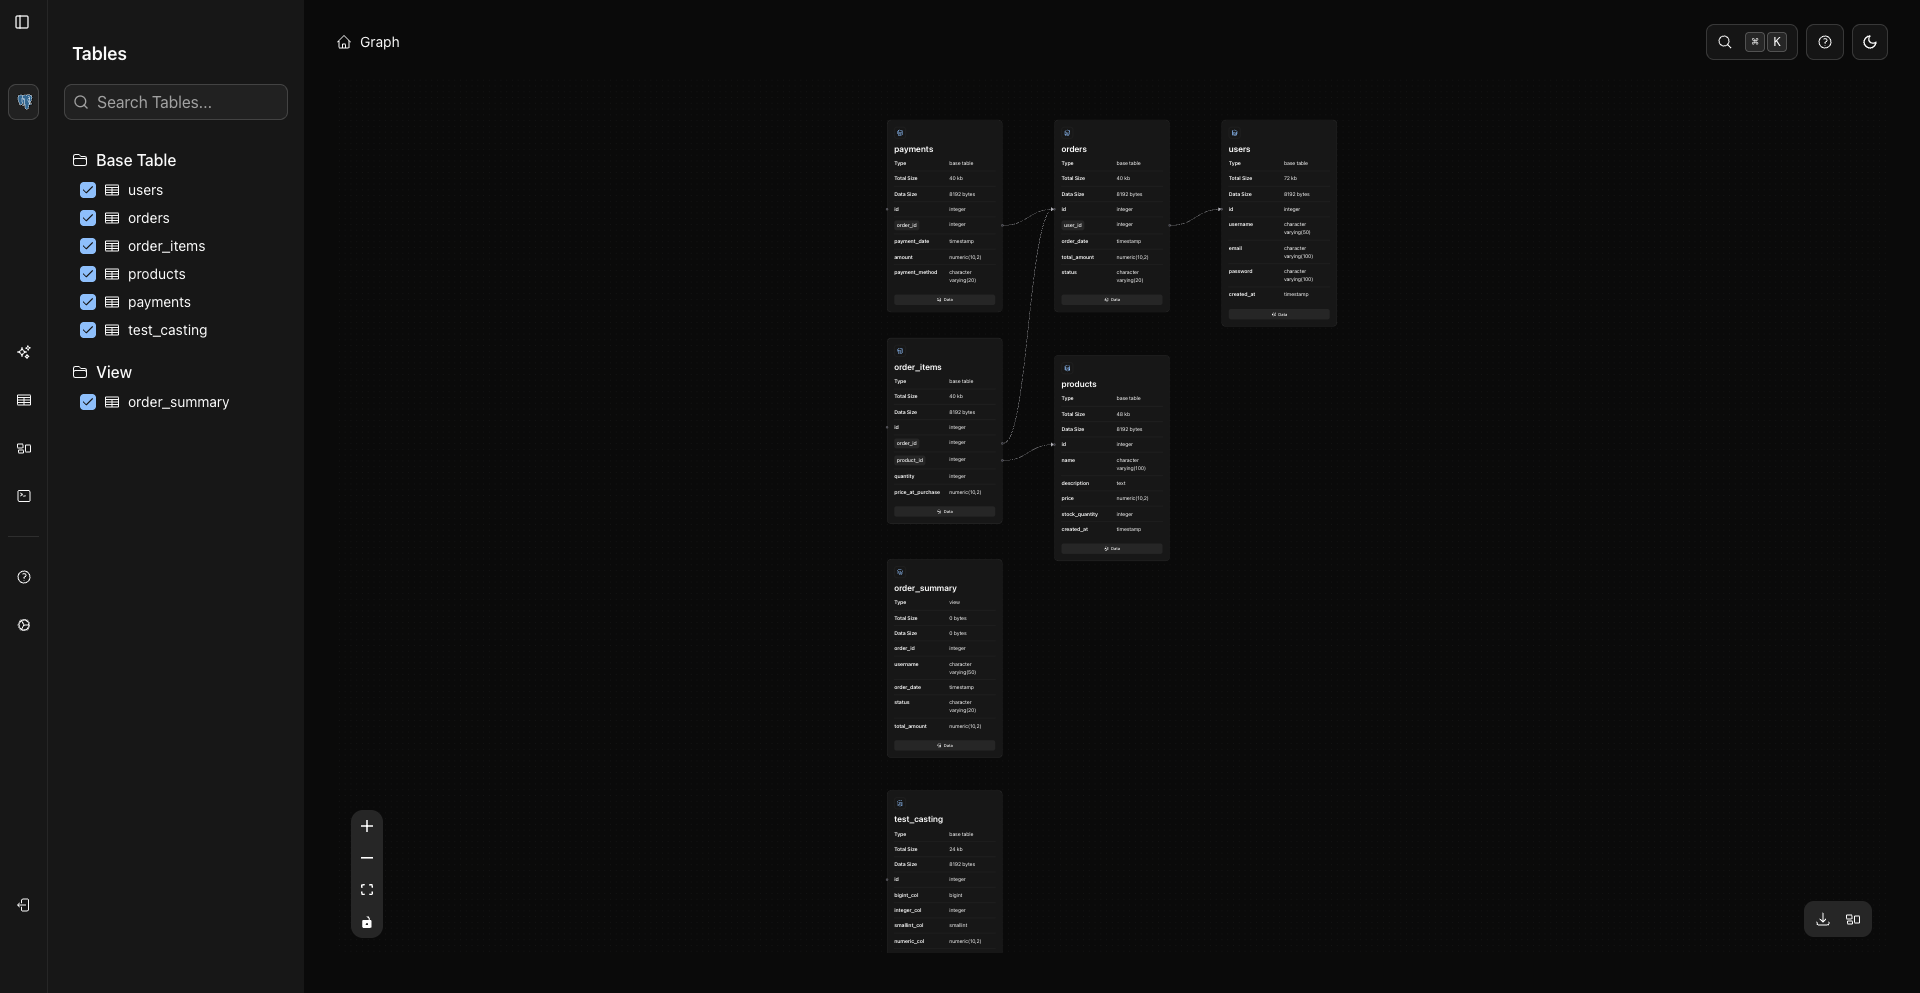
WhoDB displays your schema topology as a graph where:
- Each node represents a table
- Each edge (connecting line) represents a foreign key relationship
- Node positioning is algorithmically optimized to minimize visual complexity
- Line directions show the direction of the relationship
Table Nodes
Each table node in the graph displays:
Node Content
The name of the database table displayed prominently at the node's center
The object type (table, view, and so on) shown as a metadata row on the card
Primary key columns highlighted with a special marker
Columns that reference other tables shown with connection indicators
Node Interaction
- Each node card shows the table name, metadata attributes, and a Data button that is always visible.
- Clicking a node lazy-loads its column list into the card if it has not been loaded yet.
Understanding Node Positioning
The graph uses dagre, a hierarchical (layered) layout algorithm that:
- Arranges nodes in layers: Tables are placed in ranks based on the direction of their relationships
- Reduces line crossings: Node ordering within layers minimizes crossing edges
- Keeps components separate: Disconnected groups of tables are laid out independently and packed into a grid
Navigating the Graph
- Initial load: All nodes position based on the complete schema
- Zoom in: Focused view emphasizes nearby relationships
- Zoom out: High-level view shows overall patterns and clusters
- Pan: Navigate to different areas while maintaining relative positions
Exploring Your Schema
Sharing the Topology
- PNG Download: Use the built-in download button in the graph's lower-right controls to save the diagram as
clidey-whodb-diagram.png - PDF Export: Use browser print-to-PDF for sharing
- Screenshots: Document different zoom levels
Related Topics
Previous
Next