
Flag accounts that need a customer-success check-in
Combine declining usage with unresolved support issues to create an explainable account review list. This is a rules-based attention signal; it is not a trained churn prediction.
Before you begin#
You need a project where you can create transforms and datasets, plus an available Python script runtime. The sample contains only synthetic records. Start with the complete CSV, not a limited preview of a larger business dataset.
Follow Run a use-case recipe for the shared input, destination, and app steps.
Sample input#
Download the CSV, or copy it into Transforms → Library → Seed → Paste CSV.
Csv
account_id,previous_active_users,current_active_users,open_critical_tickets,owner
H-1,100,40,1,Ada
H-2,100,95,0,Noah
H-3,0,12,0,Ada
H-4,80,75,2,Noah
Build it in WhoDB#
- Prepare one account-level row for equal-length previous and current usage windows, plus the current count of open critical tickets. Load the fixture into Seed.
- Create Customer attention review, add Script → Python, and declare all outputs.
- Preview the rules: a usage decline of at least
30%or any critical ticket triggers attention. A zero baseline gets its own reason instead of an invented percentage. - Filter
needs_attention = trueand save tocustomer_attention. Keep the reasons and original metrics visible to the account owner. - Join or relate the account to support-ticket details only when those IDs exist in your model; a count alone does not explain the incident.
Script and output columns#
In Script → Output columns, add these names exactly, in this order:
Text
account_id, previous_active_users, current_active_users, open_critical_tickets, owner, usage_decline_pct, attention_reasons, needs_attention
Paste this code into Script. Select Python and leave Dependencies empty; it uses the Python standard library.
Python
def main(input):
    output = []
    for row in input:
        previous = int(row["previous_active_users"])
        current = int(row["current_active_users"])
        decline = round((previous - current) / previous * 100, 2) if previous > 0 else ""
        reasons = []
        if previous == 0:
            reasons.append("no_baseline")
        if previous > 0 and decline >= 30:
            reasons.append("usage_decline")
        if int(row["open_critical_tickets"]) > 0:
            reasons.append("critical_tickets")
        output.append(dict(row, usage_decline_pct=decline, attention_reasons=", ".join(reasons),
            needs_attention="usage_decline" in reasons or "critical_tickets" in reasons))
    return output
Download the script · Expected fixture output. The expected output is computed from this CSV and script; it is not a screenshot of a hosted run.
Check the result#
H-1 has 60.0% decline and both reasons; H-2 has 5.0% decline and no attention flag. H-3 has a blank decline and reason no_baseline but no attention flag under this policy. H-4 has 6.25% decline and attention because of critical tickets.
Find the controls#
These screenshots show the current pipeline configuration controls used in this recipe. They come from the manual’s synthetic demonstration workspace; they do not show this use case already executed.
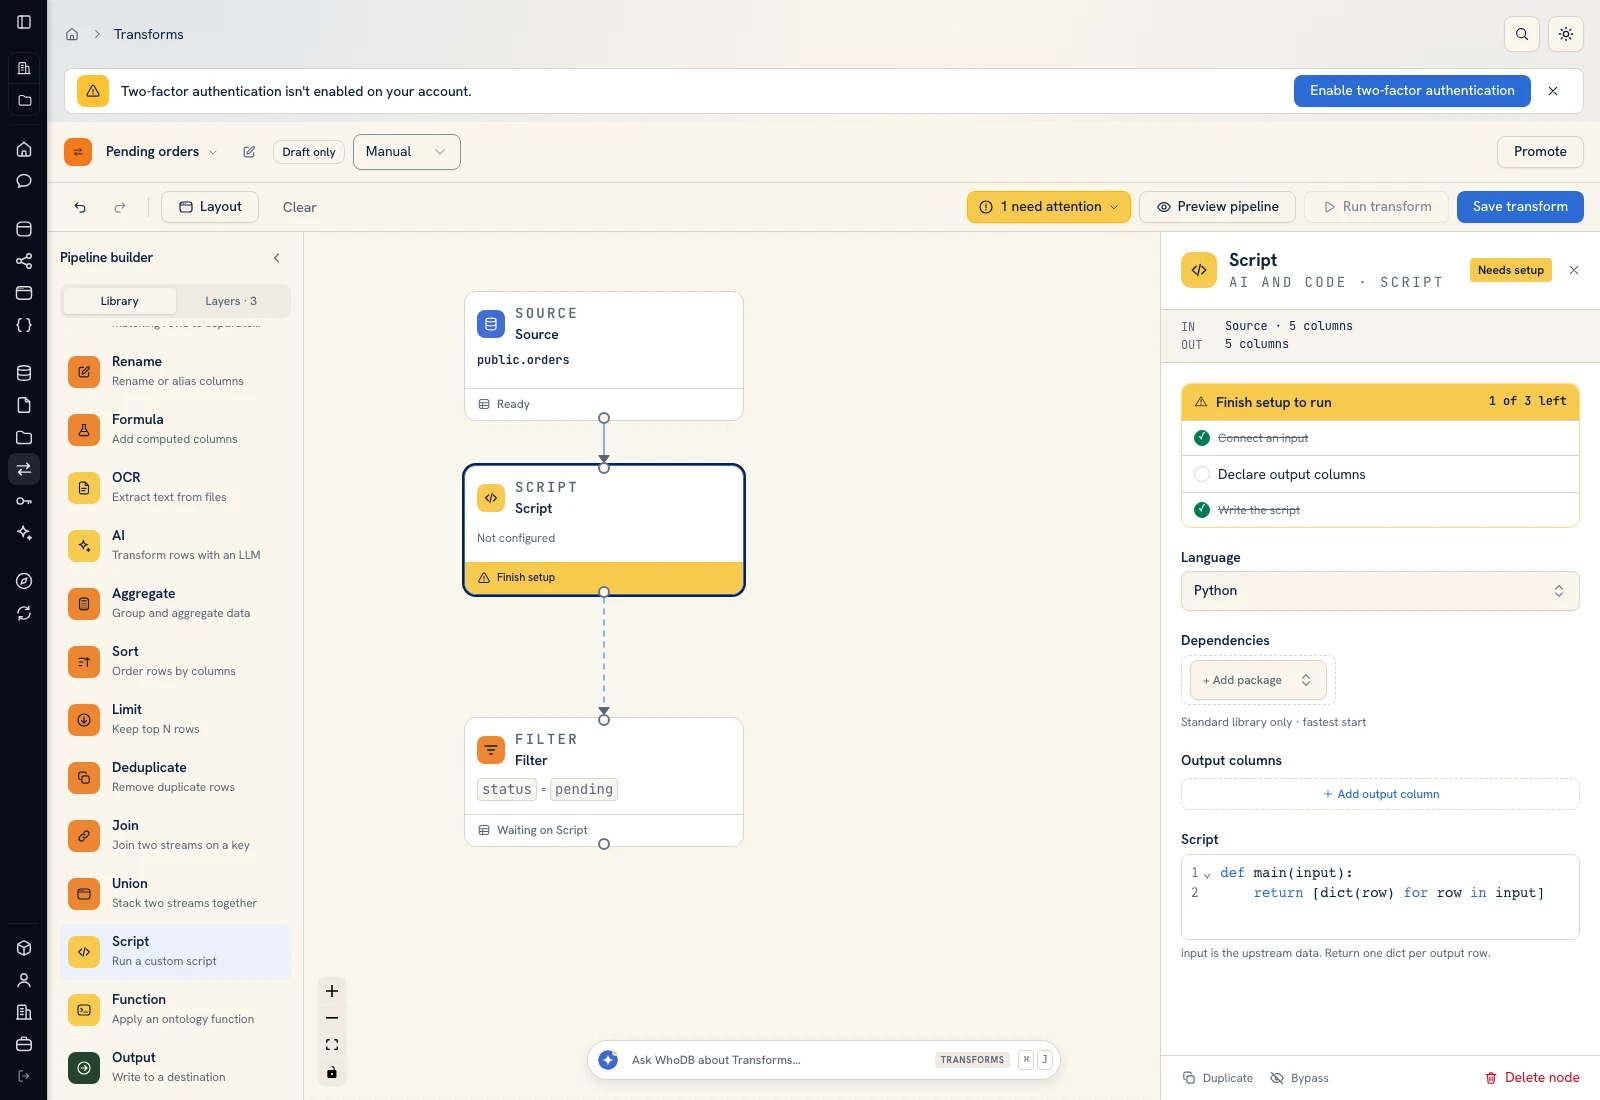 Script: select Python, declare output columns, and paste the calculation.
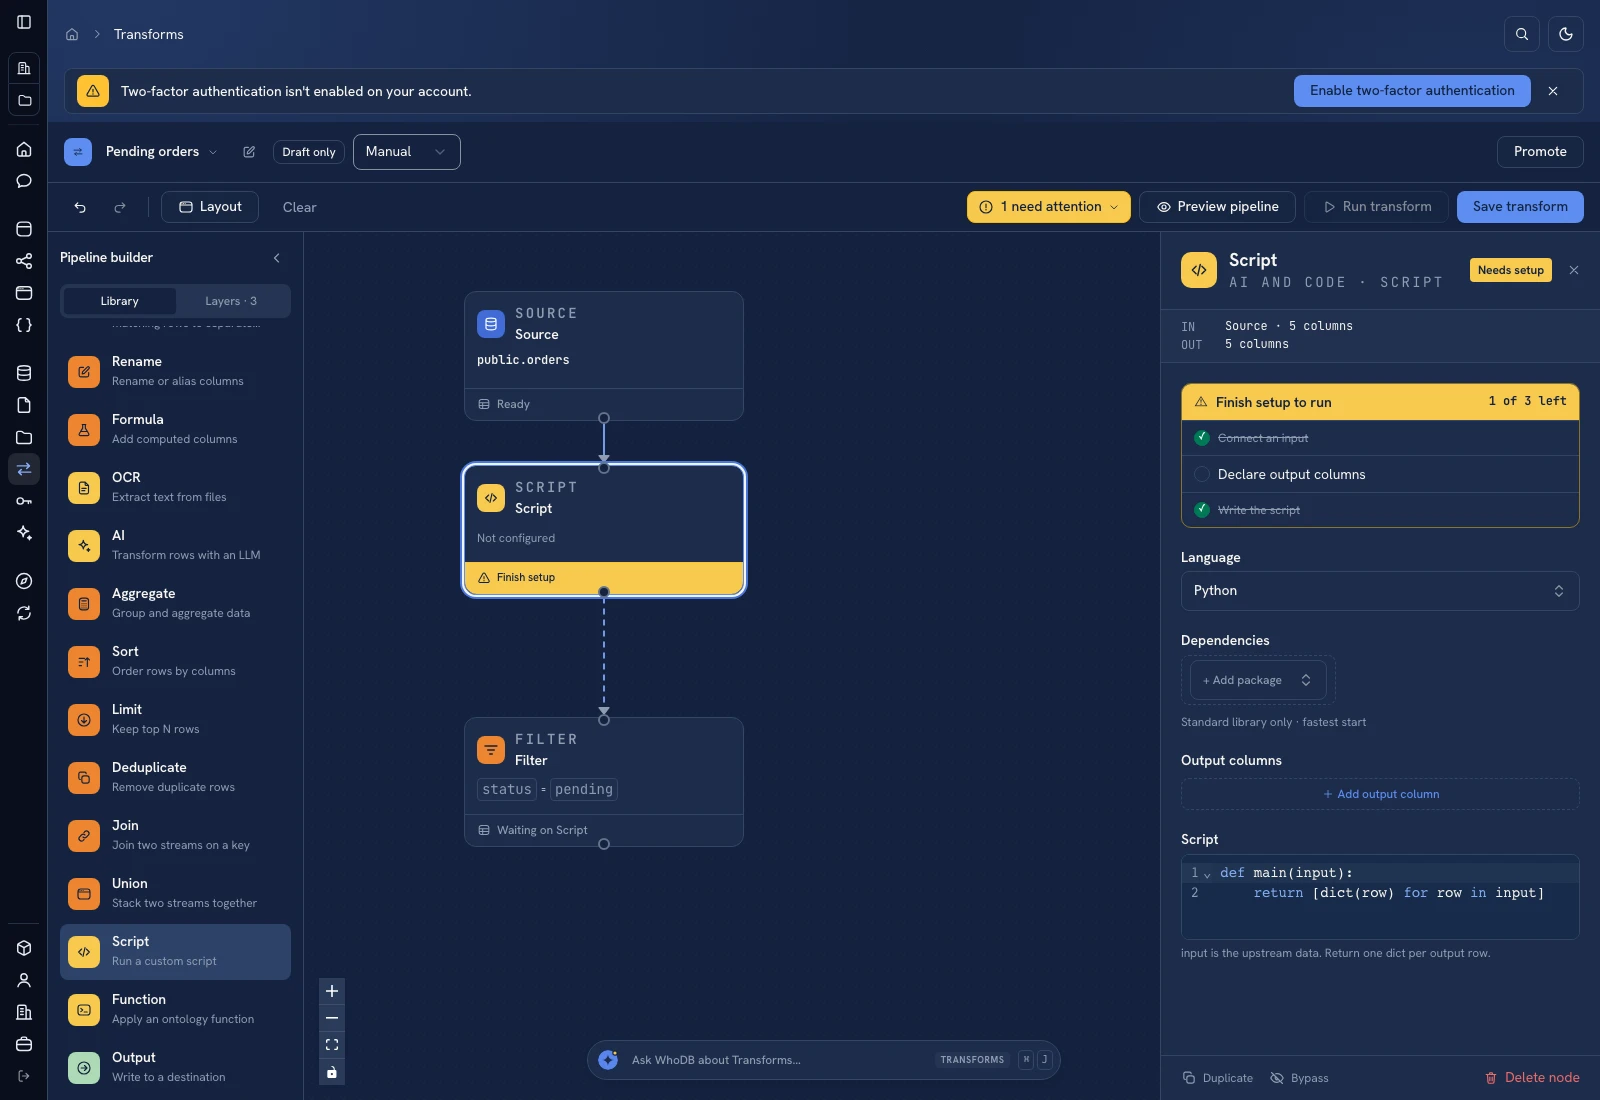 Script: select Python, declare output columns, and paste the calculation.
Put it to work#
Use active entitlements, expected seasonality, and account lifecycle when reviewing signals. A low adoption account and a newly activated account may need different actions. Compare the queue with actual account-owner findings and tune rules openly; do not present the flag as an inferred probability of churn.
For output mapping and rerun behavior, follow Write pipeline outputs. For a team-facing screen, follow Create an app and Connect state and data.
Was this page helpful?